
Our initial introduction to the ES SEM 8-10 (22 February) established that it was this group of 7 601 000 adults (19.3% of the population), that earns the most money, enjoys the best standard of living, and consumes the most media.
Today we unpack more about the way they spend their time and how they access their media.
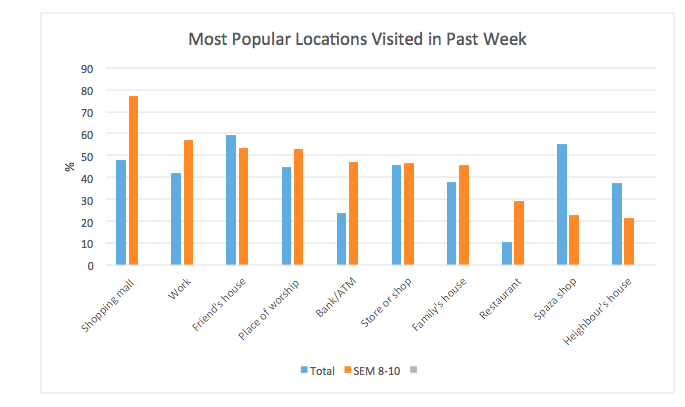
Where do they travel?
Unsurprisingly, this segment is particularly mobile, with cars being their most favoured mode of transport: 84,6% claim to have travelled outside of their homes in the past week by car. Approximately a fifth (21,7%) used either a taxi or bus, but among SEM 8 this rises to 37,3%.
The most popular destination is the shopping mall, followed by their place of work. They offset this “spending and getting” by visiting friends’ houses and places of worship. They are almost twice as likely as the population as a whole, to have visited a bank or ATM, and three times more likely to have eaten out at a restaurant.
How do they allocate their media time?
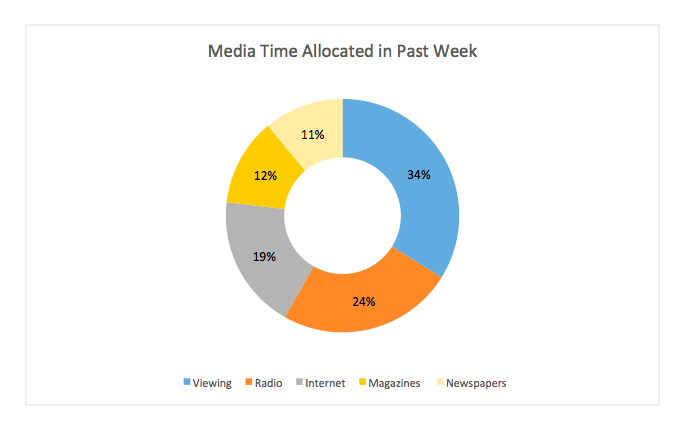
In total, members of SEM 8-10 allocate 67 and ¼ hours to media over a week. With only 168 hours in a week, this may seem startlingly high, but the explanation is that they are accomplished multi-taskers. ‘Viewing’, a term intended to embrace the multi-device consumption of video material, and radio listening account for the most time, followed by digital.
They devote the most time to media on weekdays (9 hours and 47 minutes), followed by Saturday (9 hours and 23 minutes), and then Sunday (8 hours and 57 minutes). This high weekday consumption can be attributed to in-vehicle audio listenership, and workplace internet access.
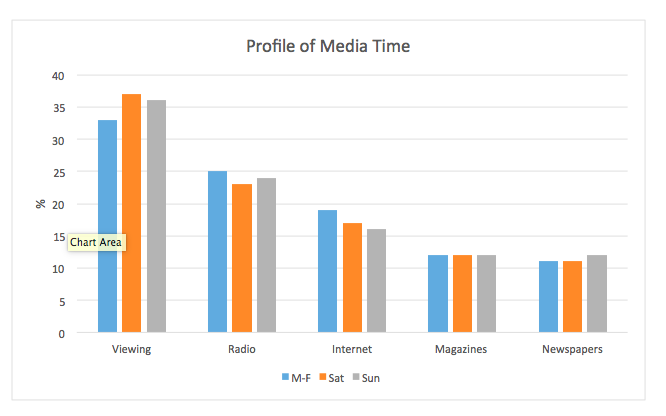
As might be expected, they allocate a higher proportion of their media consumption to viewing over weekends.
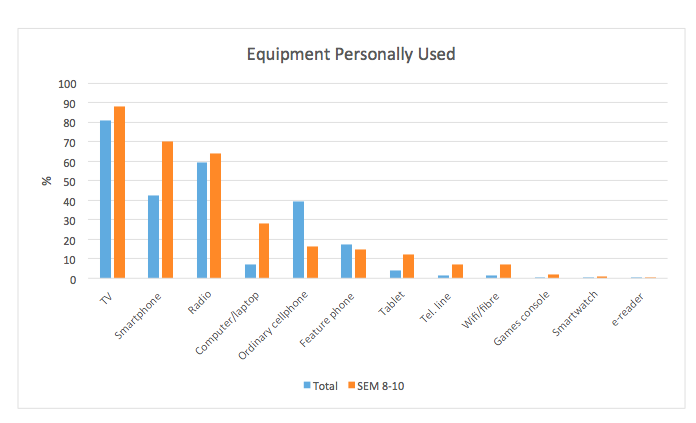
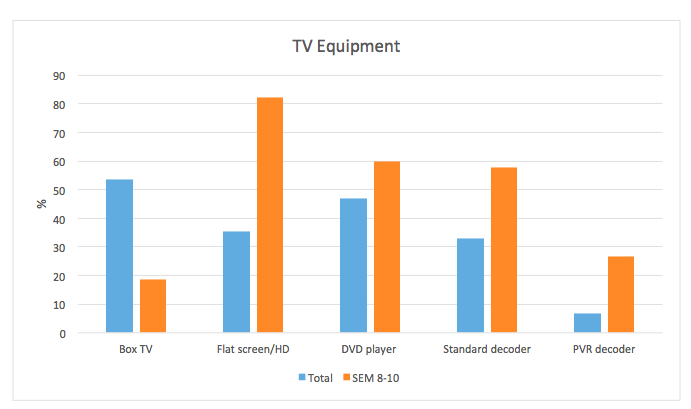
What household equipment do they favour?
Given the previous information, it is little surprise that the most popularly used equipment in their homes are TVs, followed by smartphones and then radios:
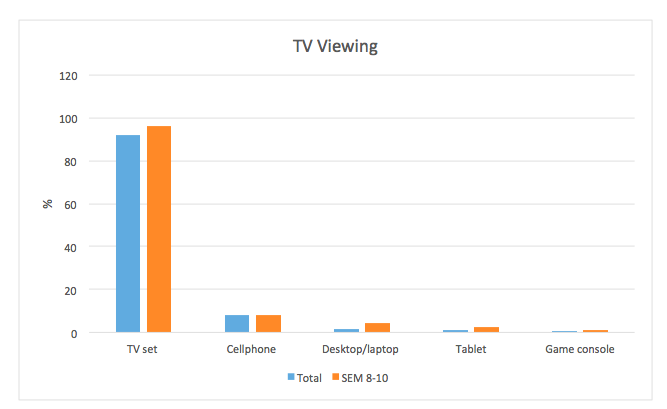
How do they like to watch TV?
They remain relatively traditional in the way in which they watch TV – predominantly on a TV set, with only 11% streaming TV on another device:
Given the predominance of flat screen/HD screens among these viewers, it is little wonder that they opt for a quality viewing experience. Add to this, the high incidence of DVD players and decoders attached to their TV’s, and it is easy to understand their penchant for “viewing”.
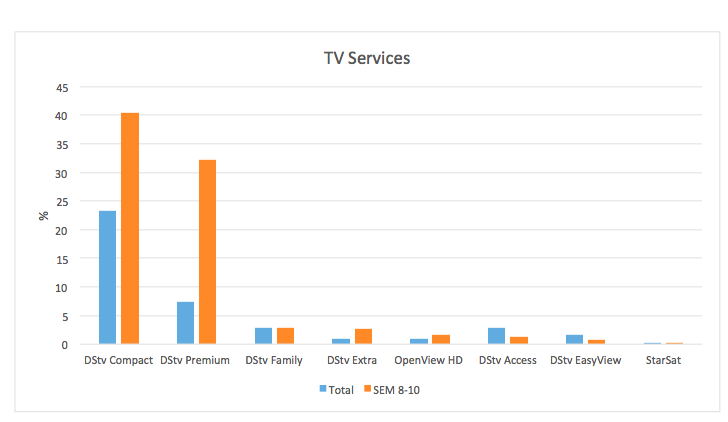
Four out of five viewers have access to pay TV. This is unquestionably DStv territory: the Compact and Premium packages are the most popular choices:
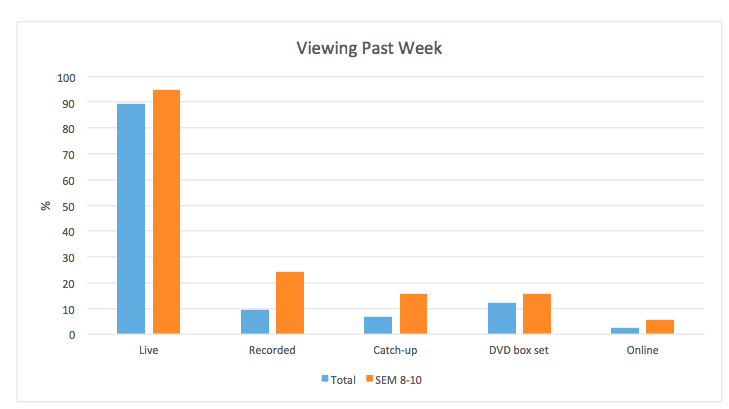
Nevertheless, most LSM 8-10 viewers choose to watch their programmes live, with recorded and Catch-Up viewing the next favoured options.
Does this conservatism extend to other media?
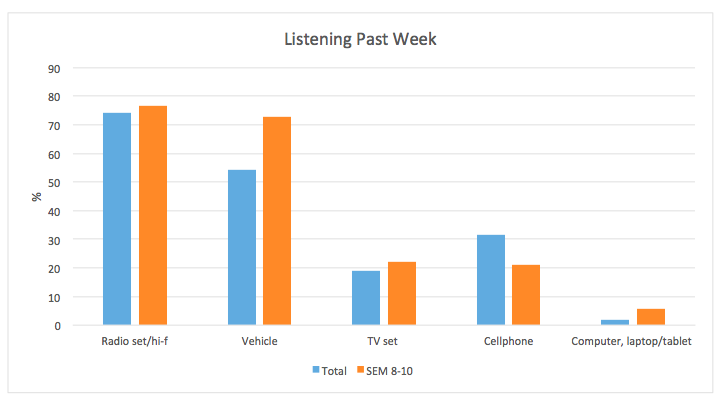
The medium that is most platform diverse is radio. Admittedly the most used device remains the traditional set/hi-fi, with in car/taxi/bus radios in second place. Listenership on TV and on cellphones tie for third place. The former is testament to the popularity of DStv’s audio bouquets. SEM 8-10 are less likely than the population as whole to listen to radio on their cellphones.
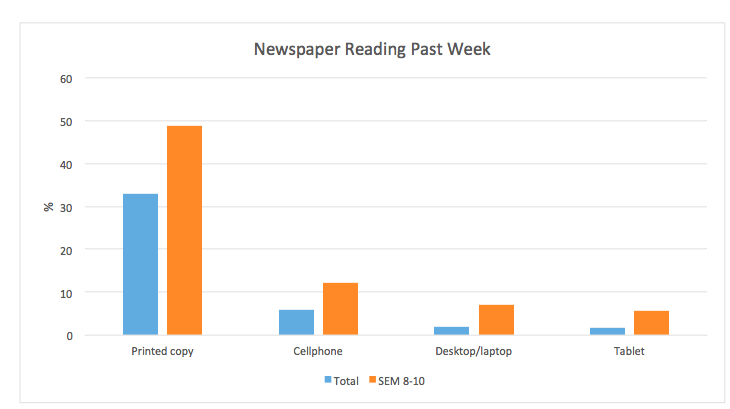
As newspaper readers they still remain relatively conservative, being four times more likely to choose a printed copy rather than using their cellphones.
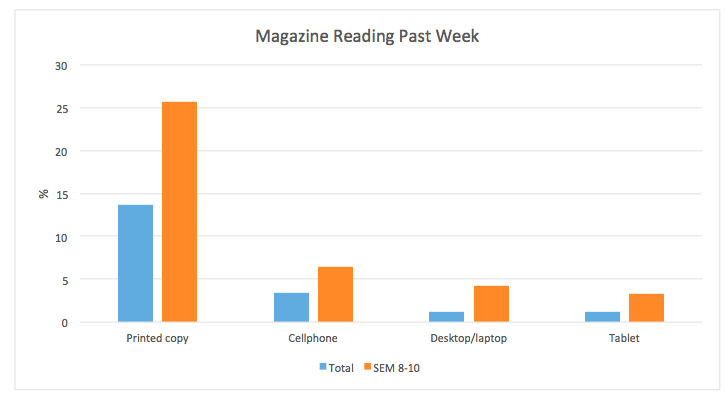
 Similarly, they prefer to read their magazines in printed format rather than digitally:
What do they do online?
While SEM 8-10 seem relatively conservative in their media consumption, they devote a substantial proportion of their time online. This will be explored in our final instalment.
Graphs: ES Jul 2016 – Jun 2017

Having spent some decades working in the media agencies, Britta Reid now relishes the opportunity to take an independent perspective on the South African media world, especially during this time of radical research transformation.


