Code4SA, the non-profit civic technology lab, and the Data Journalism School in Cape Town, using data from the local government elections, have taken an in-depth look at women in the elections, how many women stood for councillors, which parties had the most candidates – all the data that gives perspective to this important issue.
Political parties generally fielded fewer female ward candidates in the 2016 local government elections, suggesting that voters might be inclined to vote for men, on the ward lists where individual candidates are directly elected.
But South African voters appear to be proving political parties wrong: while the country has a long way to go in terms of gender parity, female candidates fared just as well as men, and in some areas, even better than their male counterparts.
(Read more here: Gender parity in party lists still elusive)
As South Africa celebrates Women’s Day, we take a closer look at women’s representation in the 2016 local government elections:
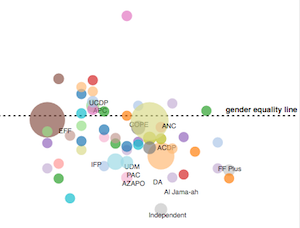
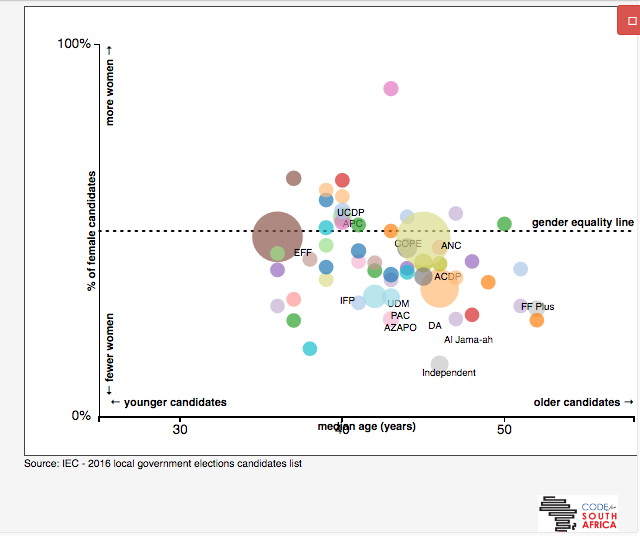
Most women candidates fell between the ages of 34 and 55. The EFF had the widest range of ages of candidates, from the most candidates under the age of 25 and candidates older than 65.

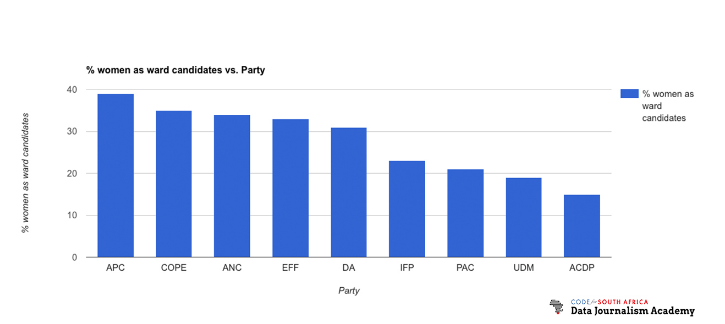
The African People’s Convention had the highest number of female ward candidates, while the African Christian Democratic Party had the lowest. The ANC, DA and EFF all hovered around the 30-35% mark.
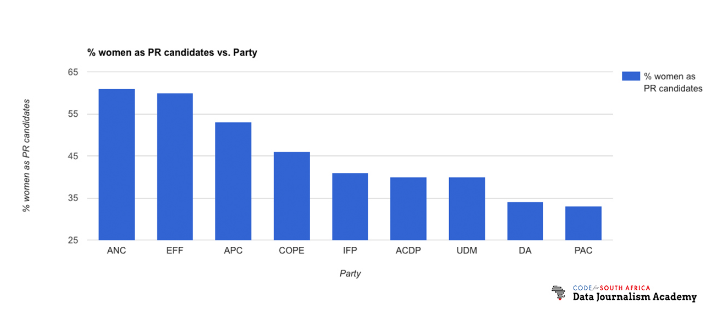
But as a percentage of PR candidates, the number of women is more varied, with the ANC topping the list of women PR candidates across parties.
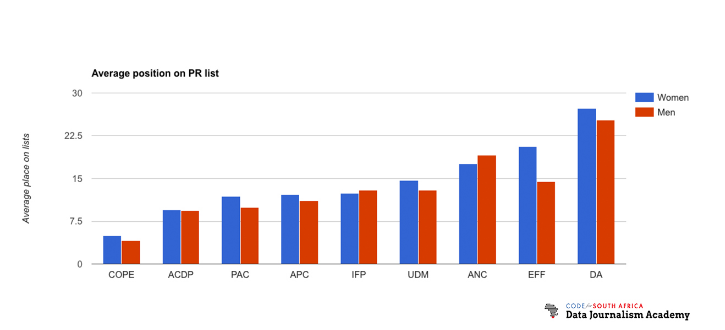
Women appeared marginally higher up than men on the PR lists for most major political parties:
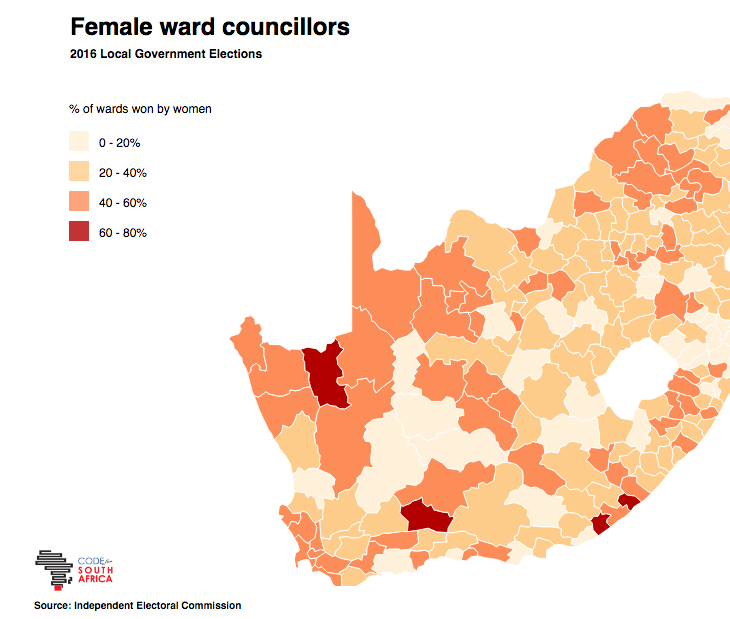
Women wom most of the votes in four wards across South Africa, and fared relatively well in other parts of the country if one takes into account that less women appeared on the ward lists. Click on the graphic for more detail.
The EFF fielded the highest number of young female candidates. The ANC also did better in terms of gender representation than many other parties, but their female candidates were slightly older.
Overall, the trend is to field less female candidates than males, across the political spectrum. And where female candidates are fielded, they tend to be older.
Code4SA has an interactive graph giving detail on this graphic. Visit Code4SA to scroll over image for detail.
Sarah Evans is news editor at Code4SA.


