There are 10 SEM groups, which may evoke memories of the SAARF LSMs, but if we remember that the SEMs (Socio-Economic Measures) were designed to reflect our unequal South African society, it should be no surprise that the Establishment Survey (July 16 – June 17) shows distribution of the population across the SEMs groups, skewed to the lower end of the population:
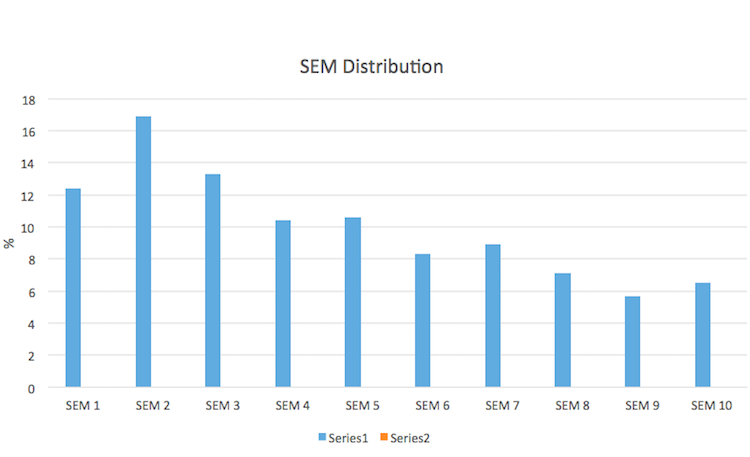
Of course, it is the other end of the population scale that receive the most attention from marketers. It is the members of the SEM 8-10 group, who earn the most money, consume the most media and enjoy the best standard of living. They constitute 19.3% of the 15+ population, which equates to 7 601 000 people.
Where do they live?
It will be no surprise that the highest concentration of these people are found in Gauteng, Western Cape and KwaZulu-Natal, residing predominantly in metropolitan (67.2%) and urban (31.1%) areas.
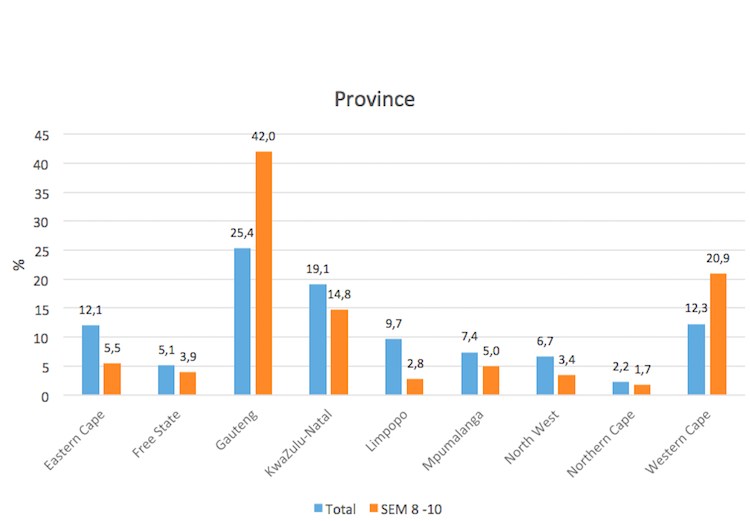
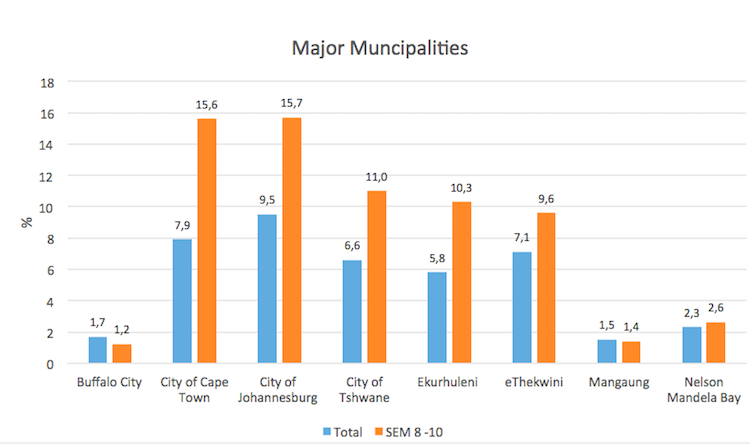
More specifically, they show a distinct preference for certain major municipalities: the cities of Cape Town, Johannesburg and Tshwane as well as Ekurhuleni and eThekwini.
How old are they?
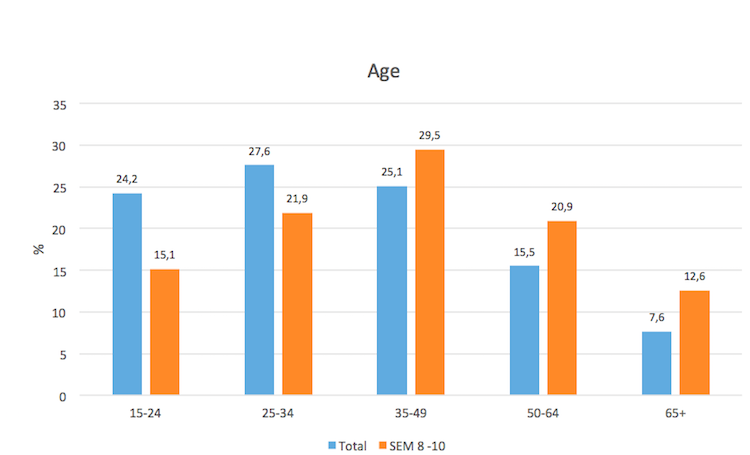
Predictably, given their comfortable circumstances, these consumers tend to be older: their average age is 42 compared with the overall adult population’s average of 37.
What is their race?
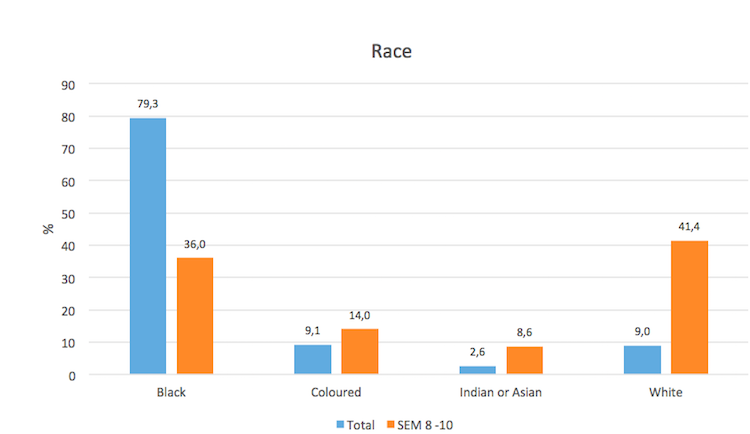
This group has disproportionately high white, coloured and Indian representation.
What is their work status?
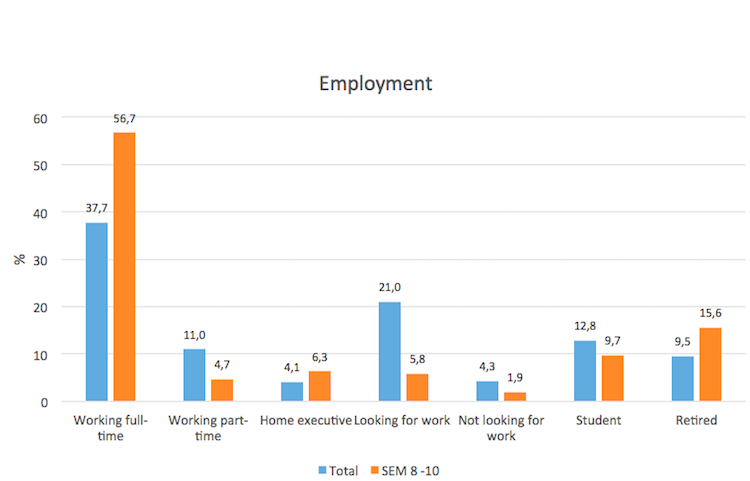
Over half (56.7%) of these people work on a full time basis, which is defined in the ES, as working for more than 30 hours a week. To put this into context, they are 50% more likely to be working full time than the average adult South African. Correlating with their older age profile, there is also a significantly higher proportion of retirees in this group: 15.6% vs 9.5% in the whole 15+ population.
How educated are they?
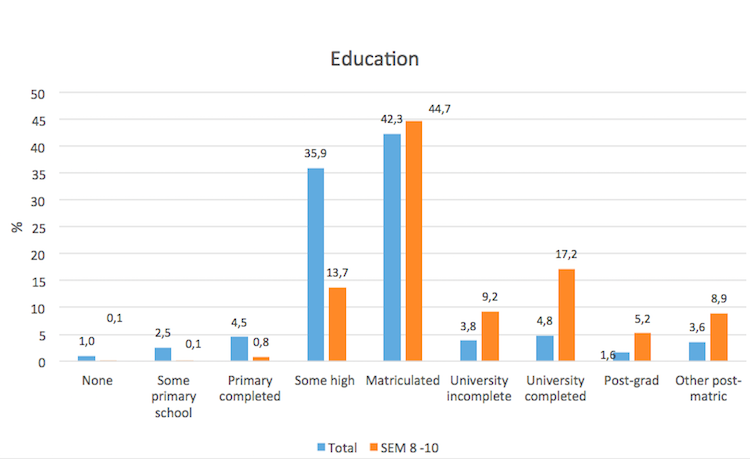
Education is useful in climbing the social and corporate ladder, and SEM 8-10 consumers are particularly privileged in that regard: 85.2% have matric or higher level of education compared with 56.1% of the population as a whole; 69.2% of adults who have completed university fall into this group, as do 63.4% of those with post-graduate qualifications.
What is their income?
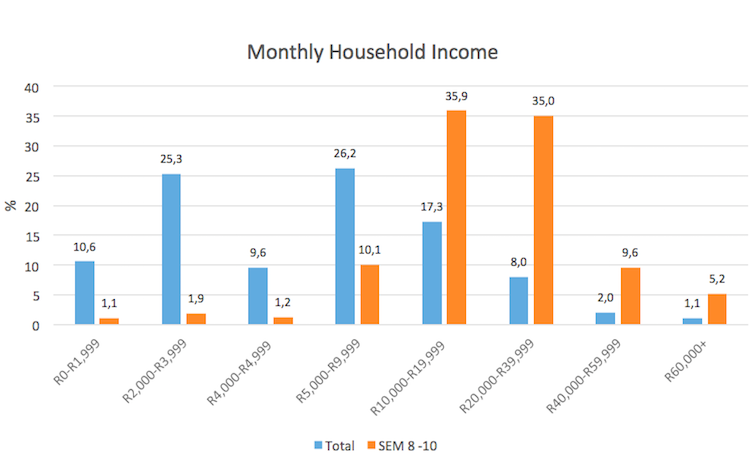
Their average household income is 2.5 times greater than the South African average, with 70.9% falling into the R10 000 – R39 999 per month bracket, and 14.8% falling into the R40 000+ classification.
 What What distinguishes their homes?
These are the people who enjoy the comforts of modern city living. In home flush toilets, running water, mains electricity, and finished floors are naturally givens. Over four fifths live in homes with more than three sleeping rooms, whilst half (51.4%) have home security.
They are twice as likely to live in gated communities (11.3% versus 5.5% of the total population), and more than 3.6 times likely to have a generator or inverter to deal with power failures (7.7% vs 2.1% of the adult population).
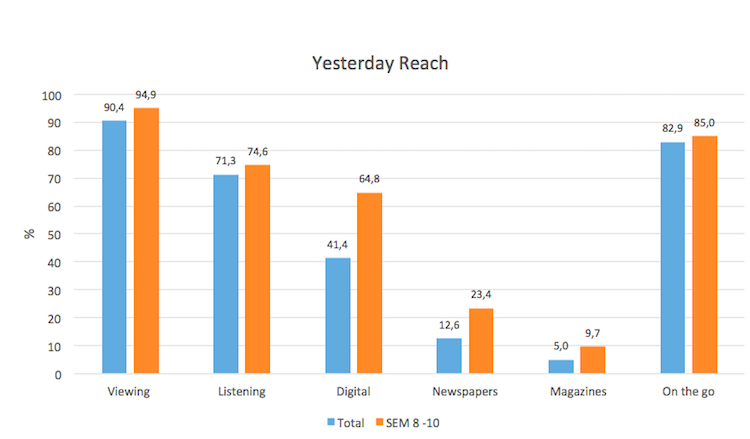
What media do they consume?
In broad terms, SEM 8-10 the heaviest consumers of media. Outdoor and broadcast media offer the highest penetration of this group, with digital media performing well. They are also much more likely to be readers.

Having spent some decades working in the media agencies, Britta Reid now relishes the opportunity to take an independent perspective on the South African media world, especially during this time of radical research transformation.


