
The Media Yearbook, the only one of its kind in Africa, offers an important and independent overview of the media industry in 2015 as well as giving important insight and perspective into global trends and forecasting for 2016. Here journalist independent consultant, Janet Watermeyer and Sune Beyers, exchange manager at Mindshare, explore the current local TV landscape.
The media industry loves to talk rather forebodingly about the imminent decline of live, linear television viewing in South Africa, and how audiences are migrating in their droves to the online video viewing environment. The reality is yes and no.
Digital on-demand video viewing is the future – where consumers can access their preferred content and consume it when they want to at their own convenience. And of course, DDT, DStv decoders, Netflix, Smart TV and VOD will offer even more viewing options and flexibility. But, as long as South African pockets are tight and entertainment comes at a cost premium, free-to-air television stations will continue to exhibit wide appeal.
So for now, South Africans continue to be avid couch potatoes, watching many hours of our favourite programmes every day.
Television continues to attract mass audiences (92% of all adults aged 15+ on a weekly basis), despite some losses from the free-to-air SABC stations and e.tv, as indicated by the recently released Jul’14 to Jun’15 AMPS survey.
DStv continues its expansion march with packaged offerings to suit any taste and budget, offering every possible content genre a viewer could wish for.
Adspend is not declining
Television holds the highest share of measured adspend and continues to grow year on year (internet and OOH are not fully inclusively measured so do skew the results).
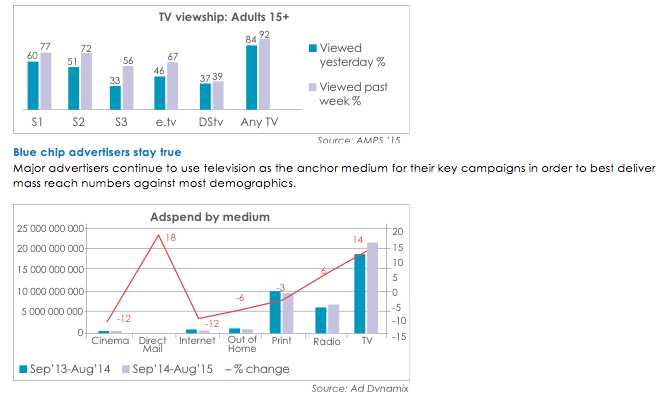 According to Ad Dynamix, the top 20 spenders account for 67% of all television revenue.
- Unilever alone took 10% of total TV share of voice.
- TV spend wars for share of voice were evident in a number of categories: FMCG (Unilever vs. P&G, Beiersdorf and Tiger Brands), Retail (Shoprite vs. Pick ‘n Pay), Network providers (Vodacom vs. Cell C, MTN is not there) and Alcoholic brands (SAB Miller vs. Brandhouse).
- Interestingly, in the financial category only Standard Bank and OUTsurance appear in the top 20 list.
Supply and demand
During the period January to October 2014 versus 2015, investment in the medium continued strongly.
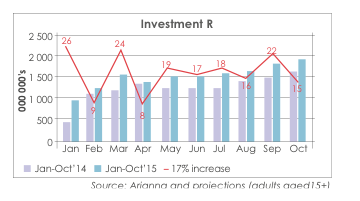
Investment for all stations is up 17% year on year, with DStv growing the fastest (up 37%) followed by S1 (up 21%). e.tv and M-Net have lost the most (both down 7%). Growth for S2 and S3 has been more modest (at 5% and 7% respectively).
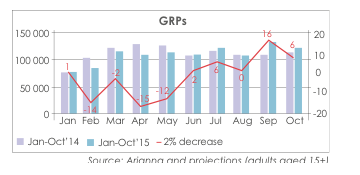
In terms of supply, GRPs purchased are down marginally. Total GRPs are more or less static year on year up to October (November and December are peak attractors so this estimate is not final).
DStv has grown by 24% and SABC1 by 7%. All the other free-to-air stations are down.
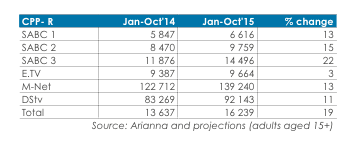
The Audience Inflation Index (cost-per-point/CPP) is up substantially, as is the cost of buying audience, up by 19%.
All stations are charging more for audience delivery, with e.tv showing only a small increase.
This story was first published in The Media Yearbook, an annual title of Wag the Dog Publishers.
![]()


