![Ask no questions, hear no lies [part 2]](https://themediaonline.co.za/wp-content/uploads/2016/03/Screenshot-2016-02-29-11.08.01.png)
Part two: Technology is increasingly providing methodologies to monitor behaviour, without having to ask questions. These typically provide the most accurate measures. Dashboard, a technology driven marketing intelligence business, has built a mobile app that some members of its opted in research community installed on their phones for a three month trial. Here the researchers discuss what they have found after having successfully piloted such a methodology in Zambia.
Part of the complexity of big data is analysing and synthesising the results.
After a three month pilot of our mobile app in Zambia among our panel, we had a tremendous amount of rich user data, automatically logged on our respondents’ phones.
Please note that these findings are from a small group of people in the pilot – 51 started and 41 completed. So these are indicative and not necessarily representative. We were more interested in the kinds of analysis that can be conducted and the potential insight to be gained from this method.
-
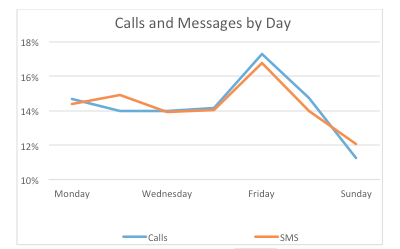
Calls
What day of the week are most calls made and received? On average, we would expect 14.3% of calls to be made each day. Friday is the busiest day for calling (17%), while Sunday is the quietest day for calling, with only 11% of calls made.
While the distribution during the week is the same for both genders, women do speak longer than men. The average duration of a female call is 129 seconds compared to men who average 84 seconds a call. Interestingly, men make more calls than women, around 3 more calls per day on average.
-
Messaging (SMS and MMS)
Similarly to calls, Sunday is the quietest day for SMS messages. Friday is the busiest day.
On average, our community receive slightly more than 2 SMS messages for each one they send. Is this how pervasive / invasive commercial SMS has become?
-
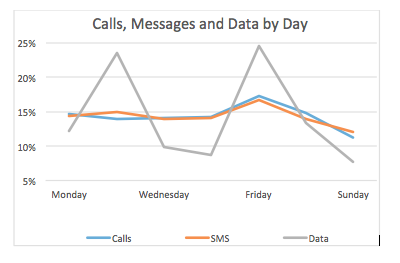
Data usage
Friday is also the heaviest data usage day, followed by Tuesday. Again Sunday exhibits the lowest data usage across the week.
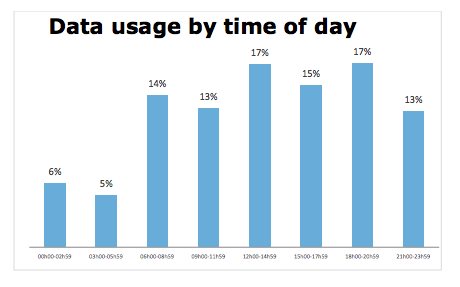
 Digging deeper into data usage, some fascinating patterns become evident. Night surfing is a small chunk, with 11% of total mobile data usage happening between midnight and 6am. Cheap night surfing data may well be the way to go for data suppliers – when there is less congestion, and especially when streaming video services can be downloaded for later viewing as YouTube is promising. The peak times for data usage include lunch and dinner.
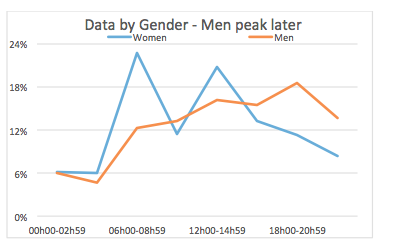
Looking at the difference between genders, women tend to use a higher proportion of their data in the morning and lunchtime, while men use more data later in the evening. Understanding patterns like these could help focus marketing communications and advertising to be more effective.
Not all data is created equal.
GSM is marginally dominant in terms of data volumes, with 54% of all data going through this channel, compared to 46% on Wi-Fi.
Downloads account for 78% of total data usage. Uploading via GSM is the least preferred option, which appears to be more to do with speed than cost.
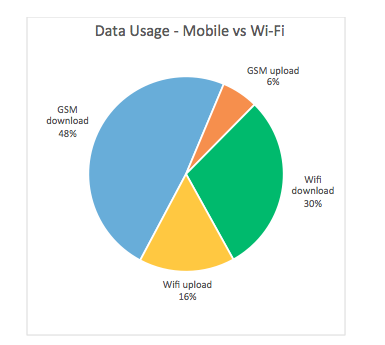
Once we break this up by gender, we see that women use Wi-Fi for downloads significantly more than men, who use over half of their total data on GSM downloads.

-
App usage
Apps have made smartphones infinitely more usable. The primary usage is to communicate more cheaply than phone calls and SMS permit, and to stay in touch. Almost all of our panelists use WhatsApp. The table below highlights app penetration by gender, with some interesting results.
Men are much more likely to use Android Messenger and Browser, while women tend to use Android e-mail much more than men. Women are more liable to play Candy Crush Saga (please don’t invite me again!), use Instagram and use Antivirus scanning. Men use the Facebook App slightly more, while women opt for Facebook Lite more frequently.

Once we examine the number of times that different APPS are used, it is clear that communication methods are supremely dominant. Over 40% of all APP usage is for communication. Productivity APPS account for a paltry 3.3%.
| APP GENRECommunication | Share of usage41.3% |
| Tools | 22.7% |
| Phone functions (settings, background applications) | 6.3% |
| Media & Video | 5.0% |
| Systems data | 4.7% |
| Social | 4.4% |
| Productivity | 3.3% |
| Music & Audio | 2.5% |
| Photography | 2.4% |
| Books & Reference | 1.2% |
| Business | 1.0% |
-
Websites
There are so many different websites visited, and yet a few stand out as the clear leaders for traffic. As we would expect, communication and social media dominate, followed by search. Shopping and browsing is under 10%, with sports news and general news following quite closely. It is noteworthy that sports news (4.3%) is considerably more engaging than general news (2.7%).
| Genre | Share of visits |
| Social media, communication, email | 25.9% |
| Browser & search engines | 18.8% |
| Online shopping & browsing | 6.2% |
| News – Sport | 4.3% |
| Entertainment & Media | 3.8% |
| Careers | 3.6% |
| Business transactions & accounting | 2.9% |
| News | 2.7% |
| Sport betting and prediction | 2.0% |
| Networking devices/connectivity | 1.9% |
| Adult sites | 1.3% |
It must be noted that many of these sites listed are also offered as an APP, so this is incremental usage from the APP data shown previously. Google and Facebook are the most widely used sites, account for over 40% of all web visits.
| Website | % of visits |
| Google Zambia | 17.5% |
| Facebook Free | 12.6% |
| 9.8% | |
| Amplify24 | 4.4% |
| Xero | 2.8% |
| 2.3% | |
| eBay | 2.0% |
| PayPal | 1.4% |
| O2 TV Series | 1.3% |
| 1.3% | |
| Zambia Jobs | 1.2% |
So the app that we deployed has generated some thought-provoking results. Given the infancy of this approach to data collection, these are valuable first steps along the path of Big Data of mobile usage. The future is exciting indeed!


