NOTE: Last year Nielsen concluded the net/gross project where data from Jan 2017 going forward was being reported at Net rates and data from December 2016 and back-data remained at Gross rate (including 16.5% agency rate).
Television advertising spend in the United Kingdom in 2017 dipped 3.2% from the previous year, while radio spending last year jumped 5.2%.
Even though television dropped, it fell from a record high achieved in the previous year, following seven consecutive years of growth. The drop was attributed to a number of factors, including economic and political uncertainty, with a weakened pound and inflationary pressures weighing on advertisers.
Radio’s impressive increase was made even more impressive when you know that it rose to a record high.
The South African situation
Unfortunately the same positivity cannot be claimed for South African television and radio adspend. Even though the former remains the behemoth in terms of share of adspend, it fell 12% year on year to R22 billion (Feb 2017 – Jan 2018) from R25.2 billion (Feb 2016 – Jan 2017).
Radio fared slightly better, but fell 5.6% year on year from R7.3 billion (Feb 2016 – Jan 2017) to R6.9 billion (Feb 2017 – 2018).
Print and out of home also dropped, with the former shedding 7.7% and the latter seeing a substantial loss of 24%.
The top advertisers
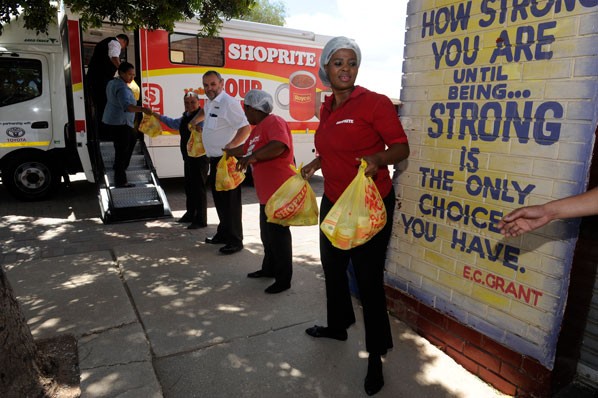
Year on year, the five advertisers who spent the most remained fairly constant, with Shoprite coming out top both years, and Clientele Life and Unilever SA both in the top five. SABMiller and ABSA moved into the top five in the last year, while Outsurance Insurance and Coca-Cola SA were both featured the previous year, but dropped out of the top five.
Here are the top 10 advertisers each year:
| Grand Total | Feb16-Jan17 | |
| Advertiser | Rand | Rand |
| Grand Total | 27 545 413 991 | 27 545 413 991 |
| SHOPRITE HOLDINGS LTD | 1 479 551 827 | 1 479 551 827 |
| UNILEVER SA | 1 435 146 104 | 1 435 146 104 |
| CLIENTELE LIFE | 1 136 053 121 | 1 136 053 121 |
| SAB MILLER | 797 747 805 | 797 747 805 |
| ABSA | 751 887 093 | 751 887 093 |
| OUTSURANCE INSURANCE | 697 967 950 | 697 967 950 |
| PICK N PAY | 632 702 663 | 632 702 663 |
| VODACOM COMMUNICATION | 604 555 341 | 604 555 341 |
| MASSMART | 569 068 539 | 569 068 539 |
| COCA COLA SOUTH AFRICA | 540 831 389 | 540 831 389 |
| Grand Total | Feb17-Jan18 | |
| Advertiser | Rand | Rand |
| Grand Total | 24 665 601 168 | 24 665 601 168 |
| SHOPRITE HOLDINGS LTD | 1 420 782 834 | 1 420 782 834 |
| CLIENTELE LIFE | 1 147 916 076 | 1 147 916 076 |
| UNILEVER SA | 918 049 156 | 918 049 156 |
| OUTSURANCE INSURANCE | 616 641 089 | 616 641 089 |
| COCA COLA SOUTH AFRICA | 614 080 345 | 614 080 345 |
| PICK N PAY | 600 217 679 | 600 217 679 |
| VODACOM COMMUNICATION | 567 634 720 | 567 634 720 |
| MASSMART | 539 818 319 | 539 818 319 |
| SAB MILLER | 538 962 674 | 538 962 674 |
| MOBILE TELEPHONE NETWORK | 527 011 606 | 527 011 606 |
All South African statistics and the top 10 advertiser data was kindly sourced by Nielsen. NOTE: Last year Nielsen concluded the net/gross project where data from Jan 2017 going forward was being reported at Net rates and data from December 2016 and back-data remained at Gross rate (including 16.5% agency rate).
Michael Bratt is a multimedia journalist at Wag the Dog, publishers of The Media Online and The Media. Follow him on Twitter @MichaelBratt8.


