The new Television Audience Measurement Survey has revealed trends in the TV sector. The August 2016 audit report reassured the media industry that “the current state of the BRC TAMS panel is good”.
The TAMS auditor, Robert Ruud, added that the service “has improved significantly since this auditor first saw the system in 2013. The panel has increased by 50%. The polling rate has gone up. The households that pass the daily quality control and are reported has gone up. The coverage has gone up. The weighting efficiency has gone up, and the weighting ranges and maximum weight has come down to acceptable levels”.
While the industry may have become accustomed to such positive assessments, five years ago it was discovered that the TAMS panel was severely dysfunctional. The achievement of the Broadcast Research Council of South Africa (BRC) and Nielsen in restoring the panel to health within a year is remarkable. Ruud rightly highlights the “rigorous daily as well as weekly oversight and management of Nielsen by the BRC research director, coupled with the strategic direction given by the BRC CEO in the management of the BRC TAMS service”, which ensure that “a stable, credible service” is delivered to the industry. Supporting the BRC staff, research savvy representatives of the TV broadcasters sit on the BRC TAMS research committee, scrutinising the results on a regular basis and ensuring data credibility and transparent management.
Credibility and transparency
Credibility and transparency has been further improved with the establishment of the TAMS User Group Forums, which facilitate engagement between the BRC, the media agencies and their representative body, Advertising Media Forum (AMF).
2017 saw the introduction of the first Establishment Survey (ES), funded by the BRC (68%) and the Publishers Research Council (PRC) (32%). Due for release in March, it is truly representative of the South African population. Besides providing the media industry with the view of the South African population size, composition and cross platform broad media consumption habits, it will also serve as the recruiting source for the TAMS panel.
The TAMS panel will have to be aligned to the ES. Considerable groundwork has already been done for this alignment. Because both the ES sample and TAMS panel are based on IHS population data, the current TAMS panel already reflects the racial composition of the country. The ES sample is based on new area definitions. The existing panel shows a 97% fit of households with the new definitions, so this final adjustment should not be too daunting.
The SEM challenge
The biggest challenge will be the adoption of a new socio-economic measure on the TAMS panel. Ruud has repeatedly pointed out that LSMs are “the TAMS systems biggest problem” as they are not “fit for purpose in a longitudinal study”. Ruud advised advertisers to avoid planning on LSMs as ratings fluctuations over time mean that planned schedules are unlikely to deliver the intended results. LSMs are largely durable based, and the acquisition of a single item e.g. DStv access can change the household status.
This is especially true in mid band households, where multigenerational families and employment driven movement drive the expansion and contraction of households, and concomitant changes in durable ownership. The scale of the issue is considerable: in the first six months of 2016, 33.7% of TAMS households changed LSM grouping. Such fluctuations not only affect rating delivery, but also place a sizeable and expensive administrative burden on Nielsen trying to maintain the panel balance.
As part of their ES contract, TNS has been tasked with the development of a new household-based, bespoke socio-economic measurement, which will be more discriminating and relevant to the evolving South African population than LSMs. The first ES data release will facilitate the introduction of the new measures to the panel. However, the transition will not be simple. Educating the media, advertising and marketing industries about the new segmentation will be a massive task.
The transition will be complicated by the fact that big advertisers make commitments and deals with the broadcasters that span a full year. While Chris Hitchings, CEO of DStv Media Sales, confirmed that “we are very excited about the future of the new ES and have full confidence in the BRC’s ability to manage the transition to a rebalanced panel as well as the introduction of the SEMs”, he also pointed out that “obviously it will be important for us to work closely with the industry in managing these important changes and we look forward to doing so.”
Futureproofing the currency
The onus for determining the way forward in terms of trading, lies with the broadcasters and their clients, not with the BRC. The launch of the new RAM data has shown that the media agencies and their clients are likely to proceed cautiously in the adoption process. The TV broadcasters are likely to take a page out of the radio broadcasters playbook: running LSMs parallel with the new SEMs for a while.
The panel is designed to measure broadcast viewing, including time shifted viewing. Ongoing expansion to 4 000 households will allow for more granular data analysis across a broader range of target markets and it will allow for more channels to reach the minimum threshold to qualify for reporting. Focusing on delivering a high quality representative panel is sensible, given that international trends underline that the TV set will continue to account for the majority of viewing for some years.
The new ES will provide amplified information into the evolution of viewing, albeit on a generic rather than channel level. It will cover viewership in terms of device, location, technology used, and platforms including internet, and how programmes are watched.
Future proofing the currency is high on the agenda: Investigations into the integration of return path data panels with people meters, an international trend, are underway.
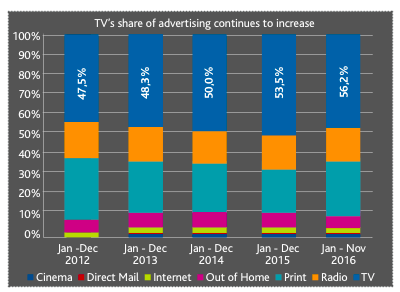
The chart below shows that advertising support for TV has remained robust, even growing during 2013 when the panel was being resuscitated. Nielsen’s Ad Dynamix shows that support has strengthened inexorably over the last three years.

Caveats are that Ad Dynamix reports on rate card investment, and does not comprehensively monitor digital investment. Of course TV has benefitted from print’s decline – its share dropped from 30% (2012) to 20.7% (2016).
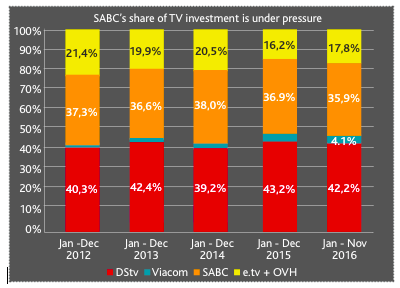
Between broadcasters, the competition has been intense. After a difficult 2015 e.tv and OVHD are showing signs of recovery. DStv, and the Viacom channels it carries continue to perform solidly, while SABC has been under pressure for the last two years:

When the panel was overhauled to be more representative of the South African population as a whole, better black representation should have favoured SABC1, and indeed that channel has increased its share of the overall TV market. Unfortunately, there has been erosion of investment in SABC3 and, to a lesser extent, SABC2. This can be attributed to SABC’s extreme local content policy.

It is a broadcasting truism that advertising revenue follows audience ratings. The TAMS panel data shows that while SABC1 has gained significant share of all adult ratings, the loss of share by SABC3 in 2016 has been swift and substantial. DStv and e.tv reaped the benefits.
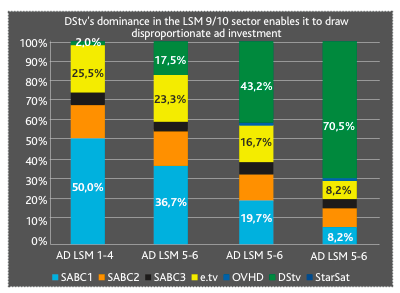
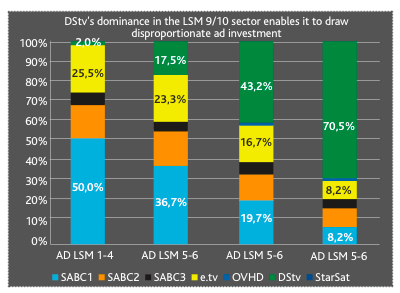
Because advertisers tend to value affluent consumers in particular, strength in the upper LSM groups enables DStv to attract ad investment, significantly ahead of its overall market share.

This story was first published in the March 2016 issue of The Media. Read the digital version by clicking on the cover.


