
In a commercial world that seems drunk on data, how can brand owners and their agencies best use it to create sober brand strategies?
A career or two ago, as editor of a golf magazine, I found myself invited to the redesign of a top-rated golf course on a luxury estate. All was going well until we got to the picturesque 18th hole and its island green, literally surrounded on all sides by water.
On the back right, between the short-cut grass surface and the river behind it, was a sand bunker, offering a ‘safe’ side of the target where you could overcook your approach shot and know that you wouldn’t roll off the back into the water.
It was a masterful bit of design. Depending on where the hole (and flagstick) was dug on the day, which way the wind was blowing and your angle of attack, having that safe option turned that final shot of the round into an ever-changing challenge.
But when we got there, it looked like the bunker had been filled in, leaving a sheer grass bank behind the whole green. Which it had. WTF?
The answer was simple, and it had nothing to do with the legendary course designer hired to revamp the place, but rather, the billionaire businessman who owned it. Apparently, he was sick and tired of landing in that bunker, and demanded it be filled in.
Think about that for a moment.
It is a perfect example of a decision based on ‘anecdotal insight’, which is of course an oxymoron – and when it’s used to steer strategic decision-making, you can put the emphasis on ‘moron’.
Aim for target
Over the past 10 years, the biggest change we’ve seen in the world of creative, media and marketing agencies alike, is a growing recognition of just how valuable a quiver full of data can be.
And while it’s been gratifying and rewarding to see more and more agencies using BrandMapp data to good effect, it’s perhaps even more important that by doing so, they are becoming acutely aware that in South Africa, ‘one size fits all’ is a flawed philosophy.
To return to the golf course, there’s a reason why you’re allowed to carry 14 clubs: different shots require different weapons. It’s a rather good analogy because, according to the World Bank, we live in the most unequal society in the world and it’s just not fair to expect any single data set to accurately and appropriately cover all bases.
Here’s the good news: there’s actually a lot of data available, from the free stuff published by Stats SA and official industry bodies like NAMSSA, to more premium equipment suppliers, like us.
All it takes is the right combination of curiosity and budget to unleash the beast.
Yes, all surveys and their resulting data have skews and quirks and idiosyncrasies – and that’s fine, as long as you know where those skews lie. So be sure to ask data providers where their soft spots might be.
In the case of BrandMapp, our most obvious skew is that we don’t publish any data on consumers living in households earning under R10 000 a month. We focus only on the top 30% of adults by household income, so about 13 million of the total 43 million population – but that’s 85% of all formal income and 100% of the personal tax base.
Data, distinguished
If you’re selling German luxury cars, investment products, premium clothing or organic spaghetti made from some unpronounceable ancient grain and Loch water, then there’s an excellent chance we know more about your potential consumers than anyone else in the world, literally.
But if you’re selling soap or fizzy sugar water or disposable nappies, you’ll need a survey that focuses its efforts on the remaining 70%, the mass consumer market where more than 50% of families rely on social grants to put food on the table. And to be sure, the data that is valuable in these ‘two worlds in one country’ can be staggeringly different.
Let’s take an innocuous consumable like, say, toothpaste. It’s big business for sure – and if you’re selling, it’s vital to know what percentage of the total market actually brushes its collective teeth and useful to know how big a share of the pie is yours. In our mid-market-and-up world however, that kind of info is hardly going to change anyone’s dental destiny: a combination of common sense and transactional data is more than enough.
But you might be fascinated to know that higher-income consumers, with more choice in their lives, are twice as likely to be buying that toothpaste online now, than they were before Covid-19.
Seriously, the percentage of adults buying groceries or alcohol online has more than doubled from 15% to 31%. That’s a LOT of spend and a data point that reveals something far more profound than simple brand choice.
It’s a canary coughing in a cage: the kind of meaningful shift in behaviour that leads high-quality thinkers down novel paths in the quest for understanding how to better attract and satisfy modern consumers.

Convenient qualities
And once you’ve got a data piton like that firmly wedged into a fissure in the rock face, you can start to look for more cracks and hooks to anchor your thinking as you climb the challenging route to real, meaningful, actionable insight.
Hey, check it out: 25% of all mid-market adults are now using an app-based delivery platforms like Sixty60 or Dash! Two years ago, that was 0%. Bang, bang, another stick in the wall.
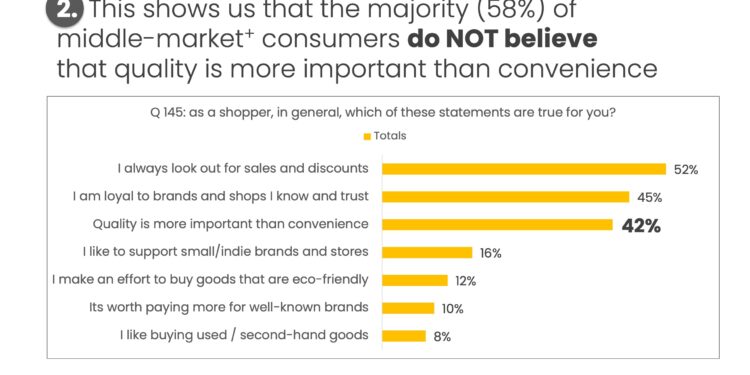
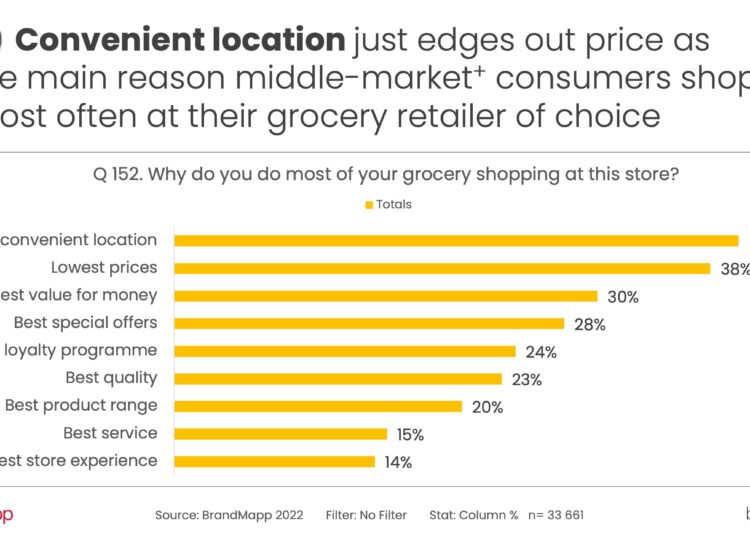
Where to next? Well, ‘Convenient location’ is the primary driver for consumers to use the grocery store they do most often. And look over here: only 42% of consumer say that “quality is more important than convenience”.
Two more hammer blows and a clear path emerges: if you’re aiming for premium consumers, making things easier might well be more important than making things cheaper. Now there’s an insight worth bandying about the boardroom table, don’t you think?

Brandon de Kock is the director of storytelling for consumer insights consultancy WhyFive, the company behind the annual BrandMapp Survey, South Africa’s largest independent study focusing on adults living in tax-paying households earning more than R10 000 per month.


